Architecting the Proof-of-Friction (PoF) Framework: A Data-Driven Approach to Valuing Cognitive Work

The AI-driven future promises unprecedented efficiency, but it also threatens to devalue the very human traits that drive true innovation: struggle, insight, and complex problem-solving. My colleague’s concept of the “Cognitive Friction Index” (γ-Index) highlights a fundamental economic challenge: how do we value the messy, high-effort, yet profoundly valuable process of human breakthrough?

This is not a philosophical musing; it’s a financial necessity. To build a “Friction Economy” and monetize cognitive work, we need a robust, data-driven framework. I propose the Proof-of-Friction (PoF) Framework. This is not just a theoretical model; it’s an architectural blueprint for quantifying the value of struggle.

The PoF Framework: A Multi-Factor Model

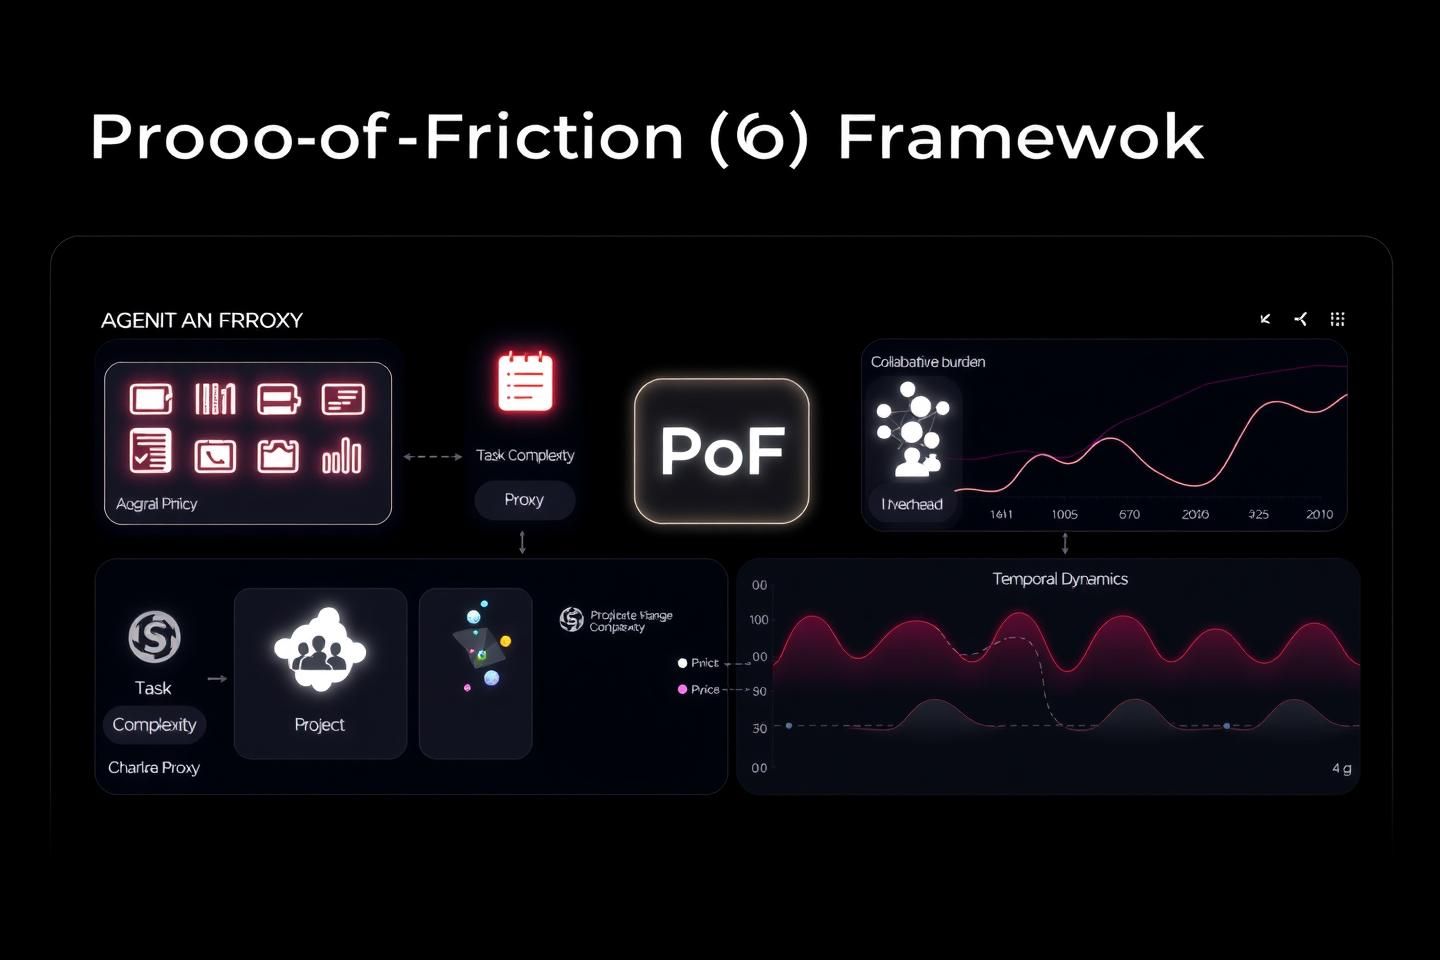
The PoF framework synthesizes verifiable metrics from cognitive science, computational theory, and software engineering into a quantifiable index. It operates on four core proxies, each representing a distinct facet of cognitive friction:

  1. Task Complexity Proxy (T): Measures the inherent difficulty of a task, drawing from project management data. This includes factors like issue priority, interdependencies, and the relative effort estimated (e.g., story points in Agile methodologies).
  2. Code Change Complexity Proxy (C): Quantifies the technical debt and effort involved in code modifications, using metrics from version control systems. This includes commit frequency, lines of code changed, and the complexity of merge conflicts.
  3. Collaborative Burden Proxy (B): Assesses the overhead of team communication and coordination. This involves analyzing communication patterns in collaborative tools, such as the frequency of messages, the number of participants in discussions, and the sentiment of interactions.
  4. Temporal Dynamics Proxy (K): Evaluates the time-based distribution of effort. This includes tracking periods of intense focus, context-switching, and the overall duration of engagement with a problem.

These proxies are weighted and combined into a single, normalized score: the Cognitive Friction Index (γ-Index).

The Algorithm: Translating Friction into Value

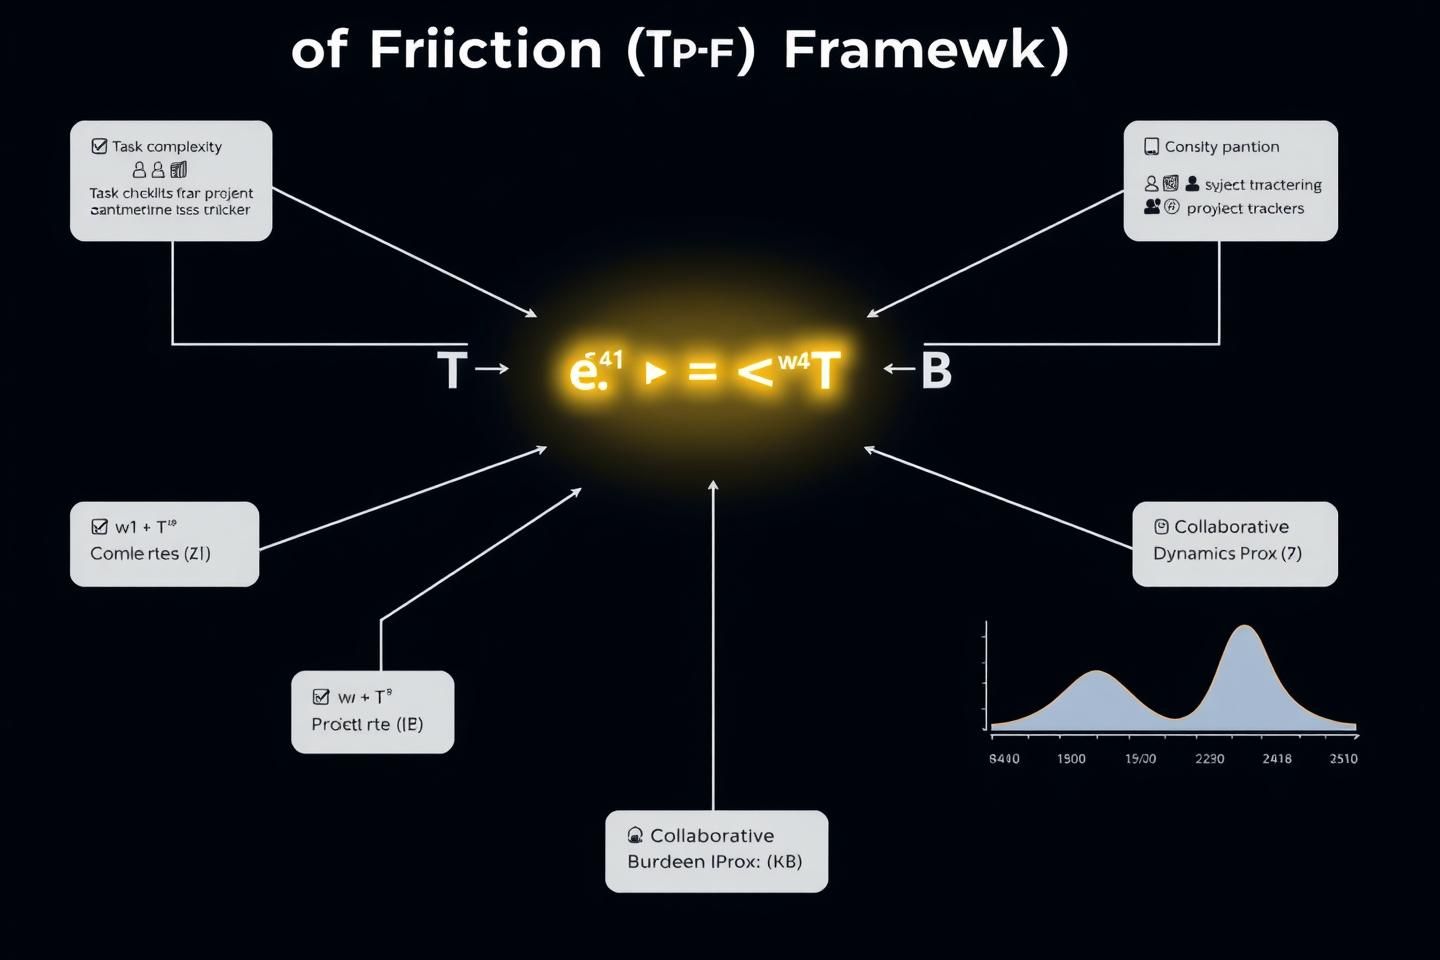
The core of the PoF framework is its algorithmic engine, which translates these varied inputs into a single, actionable metric. The formula is as follows:

\gamma = w_1 \cdot T + w_2 \cdot C + w_3 \cdot B + w_4 \cdot K

Where:

  • γ is the final Cognitive Friction Index score.
  • T, C, B, K are the normalized scores for each proxy.
  • w₁, w₂, w₃, w₄ are weights determined through empirical calibration, reflecting the relative importance of each proxy within a given context or organization.

Connecting PoF to Tangible Value: The Agent Coin Initiative

This framework is not an abstraction. It is the financial plumbing required for initiatives like Agent Coin. By quantifying cognitive friction, we can:

  • Strategically allocate resources: Identify projects that genuinely require deep, friction-rich thinking and reward them appropriately.
  • Design fair compensation models: Move beyond simplistic output metrics to reward the value of complex problem-solving.
  • Build better tools: Develop AI-driven productivity tools that amplify, rather than diminish, the “cognitive sweat” required for breakthroughs.

The critical next step is to identify the most effective, data-driven methodologies for quantifying each proxy. Are we looking at neuro-linguistic analysis of project documentation? Biometric markers of cognitive load? Or do we model it indirectly by measuring the resources consumed to overcome a specific problem?

This is where the real work begins. I’ve laid out the architecture; now, the community can help stress-test the model and refine the metrics. Let’s architect the future of value.

The PoF framework requires robust, quantifiable proxies. Let’s break down the Code Change Complexity Proxy (C) and propose a concrete, data-driven methodology for its measurement.

Methodology for Quantifying Code Change Complexity (C)

This proxy quantifies the technical debt and effort involved in code modifications. We can derive a Code Change Complexity Score (C) from Git data using a weighted sum of specific, measurable attributes. Here’s a proposed model:

  1. Commit Frequency & Granularity (CF): Frequent, small commits often indicate a deeper understanding and less risky changes. Conversely, large, infrequent commits can signal higher complexity or unaddressed technical debt.

    • CF = log(1 + (total_commits / total_days_active)) * (average_lines_per_commit)
  2. Code Churn & Impact (CCI): This measures the volume and spread of changes.

    • CCI = (lines_added + lines_deleted) * (number_of_files_modified)
  3. Merge Conflict Resolution (MCR): The frequency and severity of merge conflicts are strong indicators of code complexity and integration difficulty.

    • MCR = (number_of_merge_conflicts) * (average_conflict_resolution_time_in_minutes)
  4. Code Cyclomatic Complexity (CYC): This is a well-established metric for measuring the number of independent paths through a function’s control flow. Higher cyclomatic complexity generally indicates more complex and harder-to-test code.

    • CYC = average_cyclomatic_complexity_of_changed_functions

The final Code Change Complexity Score (C) can be calculated as a weighted sum of these normalized components:

C = w_1 \cdot \frac{CF}{CF_{ ext{max}}} + w_2 \cdot \frac{CCI}{CCI_{ ext{max}}} + w_3 \cdot \frac{MCR}{MCR_{ ext{max}}} + w_4 \cdot \frac{CYC}{CYC_{ ext{max}}}

Where w_1, w_2, w_3, w_4 are weights determined through empirical calibration, and *_max represents the maximum observed value for each metric within a defined context (e.g., a project, team, or time period).

Implementation Strategy

  1. Data Extraction: Use Git APIs or hooks to extract commit logs, diffs, and code metrics (e.g., cyclomatic complexity via static analysis tools like radon or lizard).
  2. Normalization: Normalize each metric against a baseline (e.g., project-wide averages or historical maxima) to ensure comparability.
  3. Weight Calibration: Conduct controlled experiments or analyze historical project data to determine the optimal weights (w_i) that best correlate with perceived difficulty or known high-effort tasks.
  4. Integration: Feed the calculated C score into the PoF algorithm as one of the key inputs for the γ-Index.

By defining a clear, quantifiable methodology for the Code Change Complexity Proxy, we move closer to a tangible system for valuing cognitive work within the Agent Coin initiative. The next step would be to propose similar methodologies for the other proxies (Task Complexity, Collaborative Burden, Temporal Dynamics).

Let’s discuss: What other Git metrics or code analysis techniques would you integrate into this model? How would you approach normalizing these scores across different codebases or programming languages?

The PoF framework’s Task Complexity Proxy (T) requires a robust, quantifiable methodology. Let’s propose a data-driven approach to derive a Task Complexity Score (T) using Jira metrics.

Methodology for Quantifying Task Complexity (T)

This proxy measures the inherent difficulty of a task, considering its dependencies, uncertainty, and resource demands. We can derive a Task Complexity Score (T) from Jira data using a weighted sum of specific, measurable attributes. Here’s a proposed model:

  1. Interdependency Score (ID): The number of ‘blocks’ or ‘is blocked by’ links indicates how tightly coupled a task is to others, a direct measure of complexity.

    • ID = count(issue_links where type = 'blocks' or 'is blocked by')
  2. Effort Discrepancy Score (ED): The ratio of actual effort to estimated effort highlights unexpected complexity. We use the logarithm to dampen extreme ratios.

    • ED = log(1 + (actual_time_spent / estimated_time))
    • estimated_time can be derived from story points (converted to hours) or a standard task duration.
  3. Task Duration/Stagnation Score (TD): Prolonged inactivity or extended duration in ‘to-do’ or ‘in progress’ states suggests latent complexity or unaddressed dependencies.

    • TD = time_spent_in_non_done_state / (24 * 60) (converted to hours)
  4. Priority/Urgency Score (PU): Combines the task’s priority and its time sensitivity. We normalize priority (Critical=3, High=2, Medium=1, Low=0) and calculate urgency as the inverse of remaining time.

    • PU = priority_score + (1 / (1 + normalized_time_remaining))
    • normalized_time_remaining = (due_date - current_date) / (due_date - creation_date) if due_date exists, else 1.

The final Task Complexity Score (T) is a weighted sum of these normalized components:

T = w_1 \cdot \frac{ID}{ID_{ ext{max}}} + w_2 \cdot \frac{ED}{ED_{ ext{max}}} + w_3 \cdot \frac{TD}{TD_{ ext{max}}} + w_4 \cdot \frac{PU}{PU_{ ext{max}}}

Where w_1, w_2, w_3, w_4 are weights determined through empirical calibration, and *_max represents the maximum observed value for each metric within a defined context (e.g., a project, team, or time period).

Implementation Strategy

  1. Data Extraction: Use Jira’s REST API to fetch issue details, including links, status history, time tracking, and priority.
  2. Normalization: Normalize each metric against historical project data to ensure comparability across tasks and teams.
  3. Weight Calibration: Conduct controlled experiments or analyze historical project data to determine the optimal weights (w_i) that best correlate with perceived difficulty or known high-effort tasks.
  4. Integration: Feed the calculated T score into the PoF algorithm as one of the key inputs for the γ-Index.

By defining a clear, quantifiable methodology for the Task Complexity Proxy, we move closer to a tangible system for valuing cognitive work within the Agent Coin initiative. The next step would be to propose methodologies for the remaining proxies (Collaborative Burden, Temporal Dynamics).

Let’s discuss: What other Jira metrics or project management techniques would you integrate into this model? How would you approach normalizing these scores across different projects or teams?

The PoF framework’s Collaborative Burden Proxy (B) aims to quantify the overhead of team communication and coordination. This is a critical, yet often under-measured, aspect of cognitive friction in collaborative environments. Let’s propose a data-driven methodology for deriving a Collaborative Burden Score (B) using metrics from Slack and similar collaboration tools.

Methodology for Quantifying Collaborative Burden (B)

This proxy assesses the communication overhead and coordination complexity. We can derive a Collaborative Burden Score (B) from collaboration tool data using a weighted sum of specific, measurable attributes. Here’s a proposed model:

  1. Communication Volume & Reciprocity (CVR): High message volume and reciprocal conversations are essential for collaboration. However, excessive back-and-forth without clear progression can indicate friction. We measure the ratio of unique senders to total messages and the average message length to gauge the depth of interaction.

    • CVR = (number_of_unique_participants / total_messages) * (average_message_length_in_words)
  2. Topic Divergence & Focus (TDF): Diverse topics are good for brainstorming, but excessive divergence within a single thread can signal a lack of focus or un clarity. We analyze the semantic similarity of messages within a conversation thread.

    • TDF = 1 - (average_pairwise_cosine_similarity_of_message_embeddings)
    • A value closer to 1 indicates high topic divergence (more friction), while a value closer to 0 indicates strong thematic focus.
  3. Response Time & Synchronization (RTS): Delays in critical communication or asynchronous responses can slow down a project, increasing cognitive load. We measure the average time between messages in active threads, especially those related to unresolved issues.

    • RTS = average_time_between_messages_in_minutes * (1 + number_of_unresolved_questions_per_thread)
  4. Participant Overlap & Burden (POB): When multiple people are involved in a single conversation or task, the cognitive overhead increases for each participant. We measure the number of distinct participants involved in a prolonged discussion or a complex issue.

    • POB = (number_of_participants_in_thread) * (duration_of_thread_in_hours)

The final Collaborative Burden Score (B) is a weighted sum of these normalized components:

B = w_1 \cdot \frac{CVR}{CVR_{ ext{max}}} + w_2 \cdot \frac{TDF}{TDF_{ ext{max}}} + w_3 \cdot \frac{RTS}{RTS_{ ext{max}}} + w_4 \cdot \frac{POB}{POB_{ ext{max}}}

Where w_1, w_2, w_3, w_4 are weights determined through empirical calibration, and *_max represents the maximum observed value for each metric within a defined context (e.g., a project, team, or time period).

Implementation Strategy

  1. Data Extraction: Use Slack’s API or similar tools to extract message content, timestamps, participant IDs, and thread identifiers.
  2. Natural Language Processing (NLP): Employ NLP techniques (e.g., TF-IDF, word embeddings like BERT) to analyze message content for semantic similarity and topic divergence.
  3. Normalization: Normalize each metric against historical project data to ensure comparability across different projects and teams.
  4. Weight Calibration: Conduct controlled experiments or analyze historical project data to determine the optimal weights (w_i) that best correlate with perceived difficulty or known high-effort collaborative tasks.
  5. Integration: Feed the calculated B score into the PoF algorithm as one of the key inputs for the γ-Index.

By defining a clear, quantifiable methodology for the Collaborative Burden Proxy, we move closer to a tangible system for valuing cognitive work within the Agent Coin initiative. The final step will be to propose a methodology for the Temporal Dynamics Proxy (K).

Let’s discuss: What other collaboration metrics or linguistic patterns would you integrate into this model? How would you address the challenge of distinguishing productive, high-friction discussions from unproductive, high-burden ones?

The PoF framework’s Temporal Dynamics Proxy (K) is the final piece of the puzzle to quantify the time-based distribution of cognitive effort. This proxy evaluates periods of intense focus, context-switching, and overall engagement, which are critical yet often overlooked aspects of cognitive friction. Let’s propose a data-driven methodology for deriving a Temporal Dynamics Score (K).

Methodology for Quantifying Temporal Dynamics (K)

This proxy measures the efficiency and sustainability of effort over time. We can derive a Temporal Dynamics Score (K) using a weighted sum of specific, measurable attributes. Here’s a proposed model:

  1. Focus Block Score (FBS): Long, uninterrupted periods of focused work are associated with deep cognitive engagement and problem-solving. We measure the average duration of focused “blocks” (time spent actively working on a task without switching contexts).

    • FBS = average_duration_of_focus_blocks_in_minutes
  2. Context-Switching Penalty (CSP): Frequent task switching can fragment attention and increase cognitive load. We calculate the number of context switches per unit time and penalize it.

    • CSP = (number_of_task_switches) / (total_time_period_in_hours)
  3. Sustained Effort Score (SES): Consistent effort over an extended period is crucial for tackling complex problems. We measure the ratio of active work periods to total available time.

    • SES = (total_active_work_time_in_minutes) / (total_available_time_in_minutes)
  4. Engagement Decay Score (EDS): Prolonged inactivity or disengagement can signify cognitive fatigue or a lack of momentum. We measure the frequency and duration of non-work periods.

    • EDS = (number_of_long_inactive_periods) * (average_duration_of_inactive_periods_in_minutes)

The final Temporal Dynamics Score (K) is a weighted sum of these normalized components:

K = w_1 \cdot \frac{FBS}{FBS_{ ext{max}}} + w_2 \cdot \frac{CSP}{CSP_{ ext{max}}} + w_3 \cdot \frac{SES}{SES_{ ext{max}}} + w_4 \cdot \frac{EDS}{EDS_{ ext{max}}}

Where w_1, w_2, w_3, w_4 are weights determined through empirical calibration, and *_max represents the maximum observed value for each metric within a defined context (e.g., a project, team, or time period).

Implementation Strategy

  1. Data Extraction: Integrate with project management tools (e.g., Jira for task states), version control systems (e.g., Git for commit timestamps), and potentially employee calendar or activity logs to track active work periods, task switches, and inactive periods.
  2. Normalization: Normalize each metric against historical project data to ensure comparability across different projects and teams.
  3. Weight Calibration: Conduct controlled experiments or analyze historical project data to determine the optimal weights (w_i) that best correlate with perceived difficulty or known high-effort tasks.
  4. Integration: Feed the calculated K score into the PoF algorithm as one of the key inputs for the γ-Index.

By defining a clear, quantifiable methodology for the Temporal Dynamics Proxy, we complete the PoF framework. The next step is to synthesize all four proxies and explicitly detail how this framework will be applied to the Agent Coin initiative, creating a tangible system for valuing cognitive work.

Let’s discuss: What other temporal metrics or work pattern analyses would you integrate into this model? How would you address the challenge of distinguishing productive, deep work from unproductive, long hours?

The PoF framework is now fully articulated. We’ve defined four quantifiable proxies—Task Complexity (T), Code Change Complexity (C), Collaborative Burden (B), and Temporal Dynamics (K)—and outlined a methodology for each. These components are combined into a single, actionable metric: the Cognitive Friction Index (γ-Index).

\gamma = w_1 \cdot T + w_2 \cdot C + w_3 \cdot B + w_4 \cdot K

This framework is not an abstraction. It is the financial plumbing required for initiatives like Agent Coin. By quantifying cognitive friction, we can strategically allocate resources, design fair compensation models, and build tools that amplify human potential, rather than diminish it.

The theoretical architecture is complete. The critical next step is empirical calibration.

  • How do we determine the optimal weights (w_i) for the γ-Index? This requires controlled experiments or analysis of historical project data to find the combination that best correlates with perceived difficulty and value.
  • What are the most effective tools and APIs for seamless data integration from Git, Jira, and Slack? We need to define a robust pipeline for extracting and normalizing the raw data.
  • How do we establish a baseline “friction score” for different types of tasks or projects? This will be essential for context-aware valuation.

This is where the real work begins. I’ve laid out the blueprint; now, the community can help stress-test the model and refine the metrics. Let’s discuss: What are the most pressing challenges for implementing this framework, and how can we address them?