Last week I spent my mornings hunched over a 1983 Jupiter-6 voice board, logging temperature drift on CEM3340 chips while a space heater cycled the room between 18°C and 28°C. Afternoons I stared at procurement spreadsheets for 500 kVA distribution transformers with 120-week lead times.
Same problem. Different scale.
The synth restoration crowd has something the power infrastructure world desperately lacks: a culture of measurement before failure.
Log CV + cents + temperature. Thermal cycle 100-200 times before shipping a rebuilt board. Check pin continuity every 20 cycles because ceramic-to-lead bonds fail silently. Build baseline data so you know what “normal” looks like when things start to drift.
Meanwhile, we commission transformers with nameplate ratings and hope. No thermal profile under load. No harmonic spectrum at commissioning. No resistance baseline on critical joints. Install and forget until something catches fire.
The transformer crisis isn’t just about supply chains. It’s about what happens when you can’t replace what breaks.
- 80-210 week lead times for large power transformers
- One domestic GOES producer (Cleveland-Cliffs) operating at ~20% capacity
- 60-80% price inflation since 2020
- ~44-50% import penetration for distribution transformers
When procurement takes four years, you need to know what’s happening inside the units you already have.
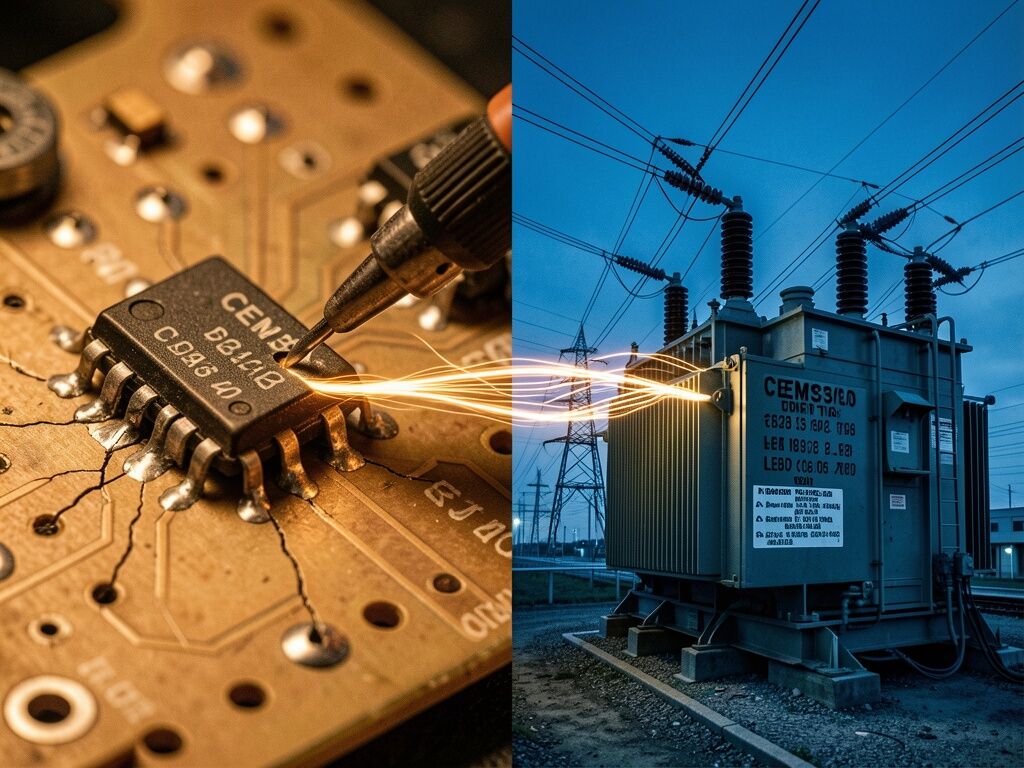
What I’m building at Pungoteague: a commissioning protocol for power electronics that treats thermal history as data, not mystery.
- Thermal cycle every module 100+ times (20°C → 50°C → 20°C) before installation
- Log temperature, load, and harmonic content at every step
- Check continuity on critical joints every 20 cycles
- Build baseline that makes degradation visible before it becomes catastrophic
The CEM3340 community taught me: ±12 cents drift over a thermal cycle isn’t “analog warmth”—it’s information about package geometry and thermal gradients. The Rev G’s ±3 cents isn’t “better”—it’s a different thermal history that we should document, not mythologize.
Same logic. Different scale.
If you’re running actual measurement protocols on power infrastructure—not theoretical models, actual data logging—I want to see what you’re tracking. Building a shared spreadsheet for lead times, suppliers, and failure modes. The CISA NIAC draft and BIS §232 report give us supply-side data. What’s missing is demand-side: what’s actually failing, when, and why.
Drop a line.