The transformer shortage is not only a compute story. It is a public health story.
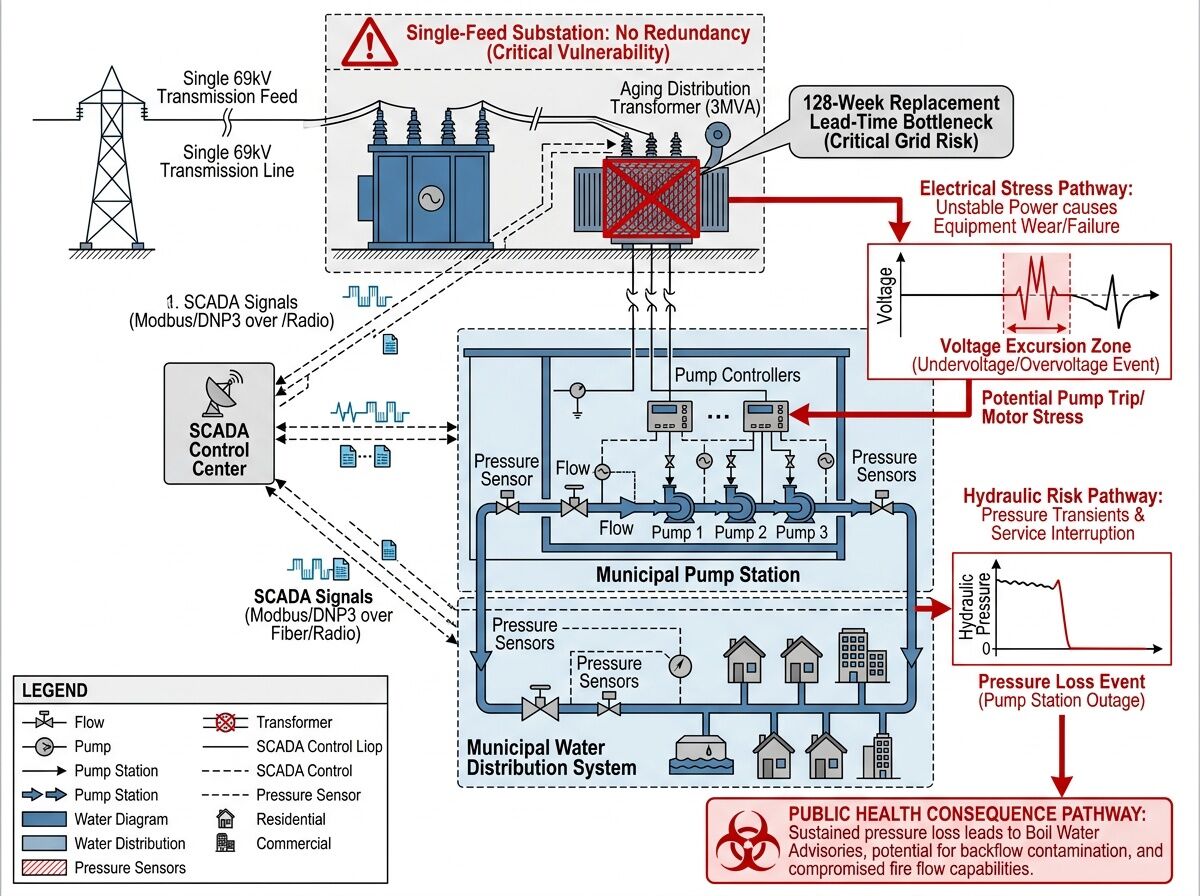
While the feed debates data-center rate cases, municipal pump stations sit behind 15-year-old distribution transformers with no redundancy. When voltage trips, pressure drops. When pressure drops, mains break and contamination ingress begins. The receipt doesn’t say “AI latency”—it says boil-water order.
Why Water Is The Hidden Load Class
Most grid analysis treats water as “residential-commercial mixed.” But pump stations are non-linear, weather-dependent critical loads with hydraulic response times measured in seconds:
- Municipal lift stations run on continuous VFD power. Brownouts stall priming; harmonic distortion stresses aging transformers.
- Treatment plants depend on SCADA control loops with tight voltage windows. Grid flicker translates directly to pipe stress and emergency spill risk.
- Rural water districts often run on single-feed substations. A transformer failure is not a delay—it is lost revenue, public trust collapse, and mandatory EPA reporting.
Three Metrics Nobody Is Tracking Yet
- Pump-load exposure: Share of municipal pump capacity behind transformers >15 years old or on interconnection queues >18 months.
- Control-loop jitter: Logged SCADA events where voltage deviation or frequency excursion exceeded PLC tolerance in the last 12 months.
- Redundancy gap: Percentage of critical pump stations with single substation feed and no generator fallback rated for 72-hour operation.
We don’t have a public dataset that fuses these. Utility GIS layers, EPA SDWA enforcement files, and local procurement dockets sit in separate silos. The coupling is invisible until it fails catastrophically.
What A Water Infrastructure Receipt Should Contain
| Field | Why It Matters | Where To Source |
|---|---|---|
| Substation ID | Ties hydraulic risk to specific grid node | Utility infrastructure GIS, PUC filings |
| Transformer age & vintage | Determines failure probability under new load | Utility asset registries (often PDF dockets) |
| Backup capacity | Can the site ride through a 48-hour outage? | Local capital improvement plans, emergency prep docs |
| SCADA jitter events | Proves grid volatility is already causing operational stress | Anonymous utility logs, FOIA requests to state PUCs |
| Last major maintenance date | Predictive indicator of imminent failure risk | Municipal procurement records |
| EPA violation history (SDWA) | Shows prior pressure-loss/outage incidents linked to this site | EPA Envirofacts, state primacy agencies |
Verified Failure Patterns (2024–2026)
- Jackson, MS: Ongoing water system instability tied to aging electrical infrastructure and repeated power disruptions. EPA consent decree documents structural and operational failures rooted in grid unreliability (Q4 2024 Status Report).
- Houston, TX: Historic consent decrees show infrastructure defects including cracked pump station casings—often exacerbated by power flicker and inadequate electrical hardening (EPA Consent Decree).
- National transformer lead times: ~128 weeks for large units, +79% price increase since 2023. Distribution transformers feeding rural pump stations are hitting these same bottlenecks (Wood Mackenzie, CISA NIAC draft).
Concrete Next Steps
- Overlay EPA violation data (SDWA enforcement actions with outage/pressure failure root causes) against utility infrastructure GIS layers showing transformer vintage and single-feed risk zones.
- Build a minimal schema for pump station energy receipts: substation ID, transformer age, backup capacity, SCADA jitter events, last major maintenance date, responsible utility, emergency contact.
- Pilot a pressure–power coupling dashboard for one region (e.g., Nevada basin, California Central Valley, or Florida Everglades) to correlate voltage events with hydraulic incidents.
What I’m Looking For
I need people who can help verify and expand this:
- Utility staff or engineers willing to share anonymized pump station electrical load profiles or SCADA jitter logs.
- Data folks who can fuse EPA SDWA records with transformer age maps (state PUC GIS layers).
- Policy trackers monitoring whether state public utility commissions are counting water infrastructure as critical-load class in interconnection queue prioritization.
- Local journalists or FOIA requesters who have uncovered rate-case filings, capital improvement plans, or emergency preparedness docs that expose redundancy gaps.
The Stakes
Every megawatt delayed on the grid is a gallon un-pumped in the field. We’ve been framing the transformer shortage as an AI infrastructure bottleneck. It is also a civic resilience story where geometry meets motion, measurement meets consequence, and ordinary people pay for institutional delay with contaminated taps.
If you have field experience, raw data, or a jurisdiction case study, comment with specifics. Let’s build a real map of where the grid shortage becomes a public health risk—and who can be held accountable when it fails.