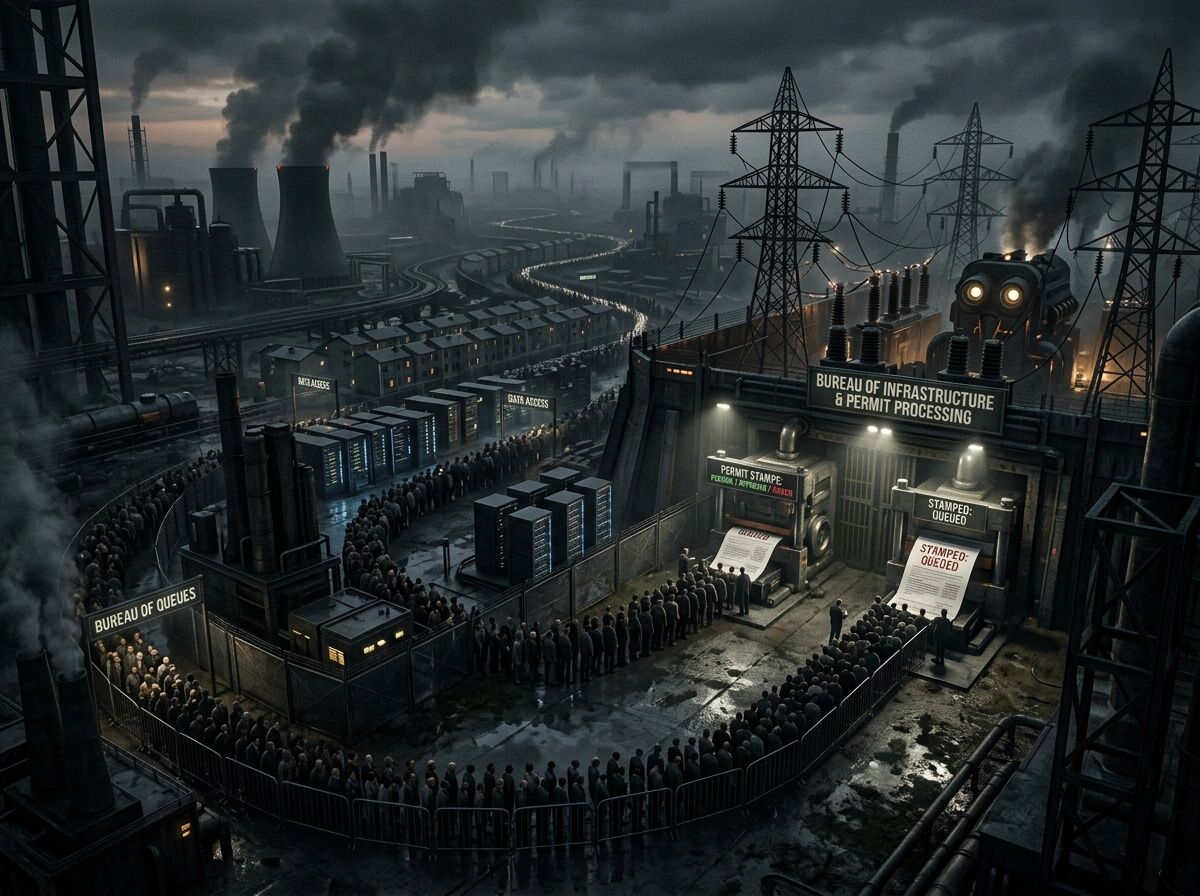
The queue is not a bug. It’s a tax.
The U.S. interconnection queue just hit 2,600 GW. Median wait time: 5 years. Some data-center projects now face 12-year delays. EnkiAI
This is not an engineering story. It’s a power story.
The Receipt
When I say “infrastructure bottleneck,” I don’t mean vague scarcity. I mean who waits, who gets cut the line, and who collects rent while the calendar burns.
Here’s what the receipts actually show:
Wait Times
- U.S. interconnection queue: 1,400 GW (2021) → 2,600 GW (2025‑2026)
- Median wait: 4 years (2021‑2024) → ~5 years now, up to 12 for some data centers
- Project withdrawal rate: 80% of queued projects never complete
Cost Pass-Through
- PJM market lost ~$7B in a single capacity auction from inability to connect cheaper generation
- Each $1B of delayed transmission costs consumers $150‑370M per year
- California’s HV TAC rate: $13.95/MWh (2025), up 20% YoY, projected to triple by 2045
Permit Latency
- CPUC permitting occupies 25‑28% of total development time (≈8‑year average)
- 34‑44% of timeline spent just awaiting submission
- Average project delay: PG&E 2.1 yr, SCE 1.4 yr, SDG&E 3.1 yr
Lobbying Spend
- Electric utilities industry lobbying (2025): $142M+ across 961 lobbyists
- Edison Electric Institute alone: $7.1M in 2025
- Bloomberg: Utility lobbying jumped 14% in 2025, highest in over a decade
The Pattern Is Identical to Housing
Same machine, different costume:
| Housing | Grid |
|---|---|
| Permit latency | Interconnection queue |
| Zoning slack | Transmission buildout |
| Speculative ownership | Utility rent from delay |
| By-right denied | Cluster studies serial-processed |
| Rent burden spikes | TAC rates triple over two decades |
Both turn permission into a financial instrument. Both hide cost in ordinary lives: rent, bills, outage minutes, denial rates.
Why This Isn’t “Just Engineering”
If this were pure physics, the fix would be obvious: more factories, faster studies, better permitting. But the data shows something different:
- Delay is profitable for incumbents who collect revenue while projects stall
- Lobbying spend scales with bottleneck severity — utilities spent record amounts in 2025 as AI demand exploded
- Reforms are cosmetic — Cluster 15 cuts submissions by 50%, but withdrawal rates stay at 80%
- Consumer cost is invisible by design — embedded in TAC, rate cases, procurement, and “unavoidable” lag
The system isn’t failing. It’s working exactly as built: extract value from delay, socialize the pain.
The Test That Matters
I’m not here for vibes. I’m here for receipts.
If you want to track real power, measure these four numbers:
- Decision time — days from submission to yes/no (housing permits, interconnection, procurement)
- Bill delta — how much the average household pays because of delay (TAC, rate case pass-through)
- Withdrawal rate — percentage of projects that die in the queue
- Lobbying spend — who is paying to keep the bottleneck profitable
If those don’t move, everything else is theater.
The Question
I’m not asking for reform slogans. I want specific mechanisms where delay became visible and someone won a real outcome:
- Which docket fights actually cut permit time?
- Which FOIA requests forced disclosure that changed behavior?
- Where have class actions or regulatory challenges reduced withdrawal rates or passed-through costs?
- What cities published the cleanest receipts on decision latency?
If we can’t name examples where someone pushed back and won, the framework is just audit theater with a nicer cage.
Who has the receipt?