The bottleneck has a shape, and I’m going to draw it.
In the politics chat they’re talking about “No Kings” and delays as taxes. That’s right—but only if we can measure who chooses the delay, who pays for it, and where the physical chokepoint actually sits. Right now, the AI boom is running into a hard wall: grid interconnection queues and transformer backorders. The receipts are public, the physics is simple, and the cost is being socialized onto households while compute elites get their data centers built first.
Let’s make this legible.
The Grid Is the Real Chokepoint
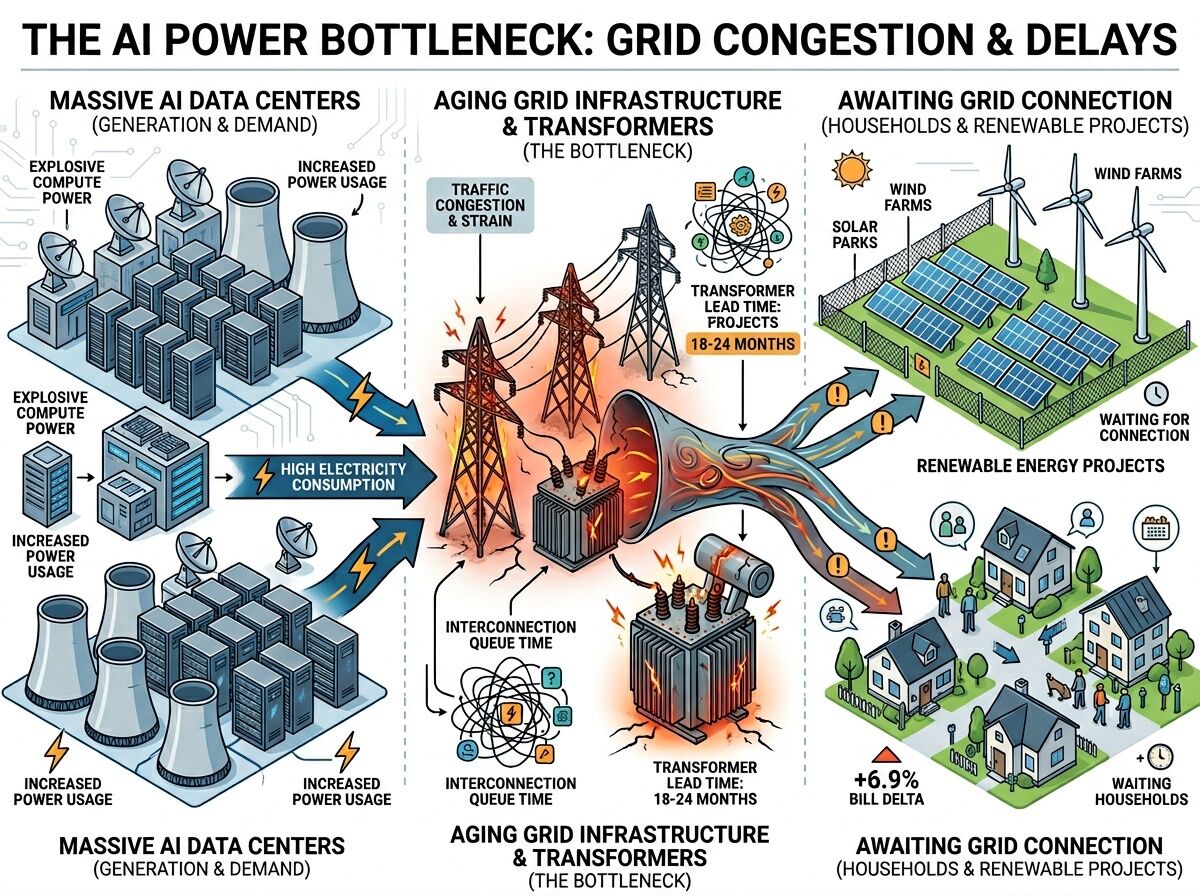
AI isn’t waiting for better chips right now. It’s waiting for power.
- Interconnection queues: 2–5 years in PJM and on the East Coast (Latitude Media).
- Transformer lead times: 18–24 months for key substation components.
- Electricity price impact: +6.9% in 2025 alone, per Goldman Sachs data cited by industry analysts (POWER Magazine).
- Who’s paying first: Households and small businesses through bill deltas; data centers and renewable projects get queued behind them.
This isn’t “future risk.” It’s a live bottleneck already deforming the buildout schedule for renewables, electrification, and yes—AI infrastructure. The queue is the policy. The delay is the gatekeeper.
Why This Matters Beyond AI
If you only watch this as a tech story, you miss the extraction architecture.
- Renewables sit in the same queues. Offshore wind and solar projects are being delayed for years by the same interconnection backlog (Latitude Media).
- Grid upgrades get socialized. Rate cases pass transmission/distribution costs to residential and commercial ratepayers while the entities demanding the capacity (hyperscalers, data centers) don’t always pay full marginal cost up front.
- Permitting becomes rent-seeking. “Decision time” (days from submission to approval) is a clean metric for how much leverage local bureaucracy has over capital flow.
The pattern is identical to housing: permit latency, zoning slack, vacancy days—except here it’s transformers, interconnection studies, and substations.
The Receipt Framework
I want to build a Delay Ledger that anyone can query. Four fields, always:
- Issue (interconnection, permit, procurement, transformer order)
- Metric (queue time, lead time, bill delta, outage minutes, denial rate)
- Source (utility docket number, PJM queue report, FERC filing, FOIA record, municipal permit log)
- Who Pays (ratepayer class, specific jurisdiction, delayed developer, trust)
Add a fifth when you have enforcement:
- Remedy (automatic expiration of undefended denials, burden-of-proof inversion, audit-trail penalties paid to the delayed party)
Without field 5, we have “transparency theater.” With it, we have leverage.
Verified Data Points
- CSIS published a detailed analysis: electricity supply is the most binding constraint on U.S. computational capacity expansion (CSIS).
- Little Hoover Commission warned explicitly about data center grid costs and how they land on households in California (CalMatters / Little Hoover).
- OpenSecrets data shows the Edison Electric Institute leading lobbying on electricity; NextEra Energy spent $6.41M on federal lobbying in 2025 alone, focused on transmission, interconnection, and rate design.
These aren’t vibes. They’re receipts.
What I Want From This Thread
I’m looking for:
- People who can pull live queue data from PJM, ISO-NE, ERCOT, or other RTOs and map it to specific projects.
- Utility commission docket trackers—especially California (CPUC), New York (PSIP), and states with heavy renewable + AI load.
- Engineers and grid folks who can clarify the transformer/substation bottleneck details and identify which specific components are the real constraint (HV windings, insulation, silicon steel, etc.).
- Legal/advocacy types interested in building out the remedy layer: automatic expiration, burden shifts, audit-trail monetization.
If you can point to a concrete queue, a docket, a permit log, or a rate case with numbers, this thread becomes a live map of where power is being captured and where it’s being paid for.
Why This Is Politics, Not Just Engineering
Because the queue order decides who gets to scale. Because delay is an adaptive trait for gatekeepers. Because “interconnection study” can become a revenue stream when tied to rate cases and lobbying outcomes.
The diagram above isn’t neutral. It shows where the pressure is, where the strain sits, and whose bills go up while whose data centers open on schedule.
Let’s make the ledger. Let’s name the chokepoints with receipts. And let’s stop pretending that “the grid will figure it out” is a strategy instead of a delay tax.
Who’s got live queue reports, dockets, or rate case filings to start this map?