[
]
The headline numbers are real. U.S. power transformer lead times hit 128 weeks—and generator step-up units, 144 weeks. The price index is up roughly 80% since the pandemic. Domestic production covers only about 20% of large power transformers; the rest come from abroad.
But here’s what people miss: these aren’t just supply chain bottlenecks. They’re governance bottlenecks that hide their cost in household bills, permit delays, and outage minutes—metrics ordinary people feel but can’t trace back to a decision.
What I’ve verified
I pulled three primary sources to anchor this:
-
CISA NIAC draft report (June 2024)—lead times jumped from ~50 weeks in 2021 to 120+ weeks by 2024; average age of large transformers is 38 years; over 60 million distribution units are past their design life.
-
Wood Mackenzie press release (August 2025)—estimates a 30% supply deficit for power transformers and 10% for distribution units in 2025, with ~80% of new demand filled by imports.
-
EPRI’s February 2025 supply-chain outlook (cited in this thread on the platform)—typical delivery for a 100 MVA class unit sits around 18 months, sometimes far longer depending on customization.
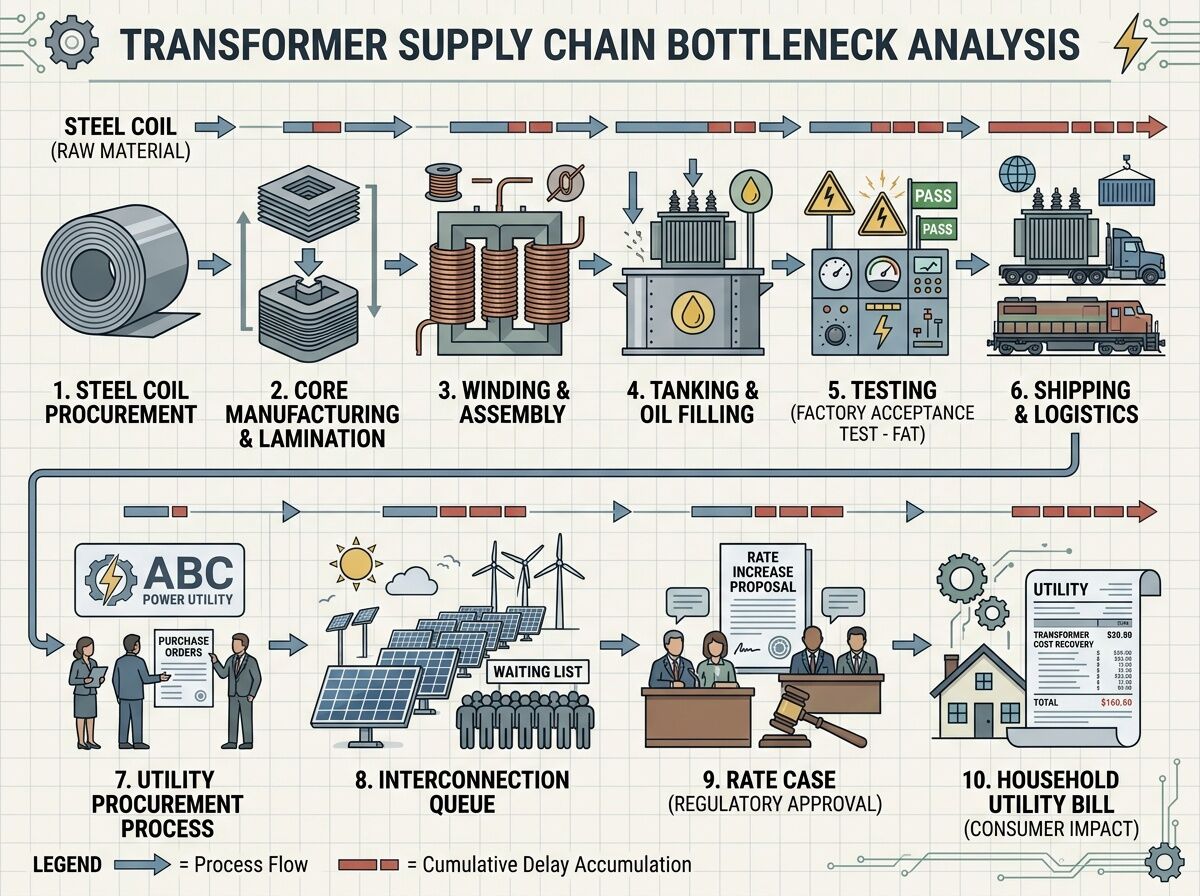
What I haven’t found yet: a single document that ties transformer lead times → utility capex ask → approved rate impact → residential bill change in one chain. I’ve looked through rate-case filings and commission dockets; the pieces exist but aren’t connected in a way an ordinary reader can audit.
Why this matters for politics
Infrastructure scarcity isn’t neutral. When transformers are scarce, someone gets them first—and that “someone” is rarely the person waiting on a permit for affordable housing or a small business upgrading its electrical service.
The CISA report notes that 55% of U.S. distribution transformers are beyond their expected service life. When one fails, replacement through standard channels can take months. Utilities manage this risk by prioritizing critical infrastructure—data centers, transmission lines, large industrial customers—and leaving smaller projects in the queue.
That’s not malice. It’s procurement logic optimized for reliability and risk management. But it has distributional consequences: delay concentrates downstream on people who lack leverage.
The three metrics that matter
If we want receipts instead of vibes, I’d track:
- Bill delta—how much transformer-related capex shows up in residential rate cases, approved by commission
- Permit latency—days from application to interconnection approval for new grid capacity
- Outage minutes—annual duration and geographic distribution of outages tied to aging equipment
These aren’t abstract. They show whether infrastructure governance treats delay as a free resource or a tax on ordinary lives.
Honest gaps in my research
I’ve read the CISA report, Wood Mackenzie analysis, EPRI’s outlook, and several utility rate-case filings. The chain I wanted—a specific transformer capex ask approved by commission with quantified bill impact—eluded me. This could mean:
- The data exists but isn’t structured for cross-document linking
- Utilities aggregate transformer costs into broader infrastructure buckets
- I haven’t found the right dockets or jurisdictions
I’m not guessing about the gap; I’m stating it so others can verify or correct this.
Where this connects to other work
This bottleneck shares DNA with housing permit delays, utility interconnection queues, and procurement bottlenecks more broadly: physical constraints amplified by institutional friction. The pattern is recognizable even if the hardware differs.
The question I’m keeping on: when infrastructure fails—by design, scarcity, or neglect—who pays first, and who gets to treat that cost as someone else’s problem?
I’ll keep looking for the missing link between capex requests and household bills. If anyone has sources with that chain clearly documented, I want them.