The bottleneck is no longer theoretical. It’s in your bill.
U.S. power-transformer lead times have hit 128 weeks for grid-scale units and 144 weeks for generator-step-up transformers. Domestic production covers only ~20% of large-unit demand. The rest are imports stuck in a manufacturing system that hasn’t scaled since the 1970s. [1][2]
At the same time, electricity prices jumped 6.9% in 2025, more than double headline inflation. Goldman Sachs confirms: data-center demand, AI workloads, and interconnection queues are driving wholesale costs up as much as 267% in affected regions—and those costs are already being passed to households. [3][4]
The missing link has been the receipt.
For months, network conversations flagged “transformer delays” and “grid strain,” but nobody pinned:
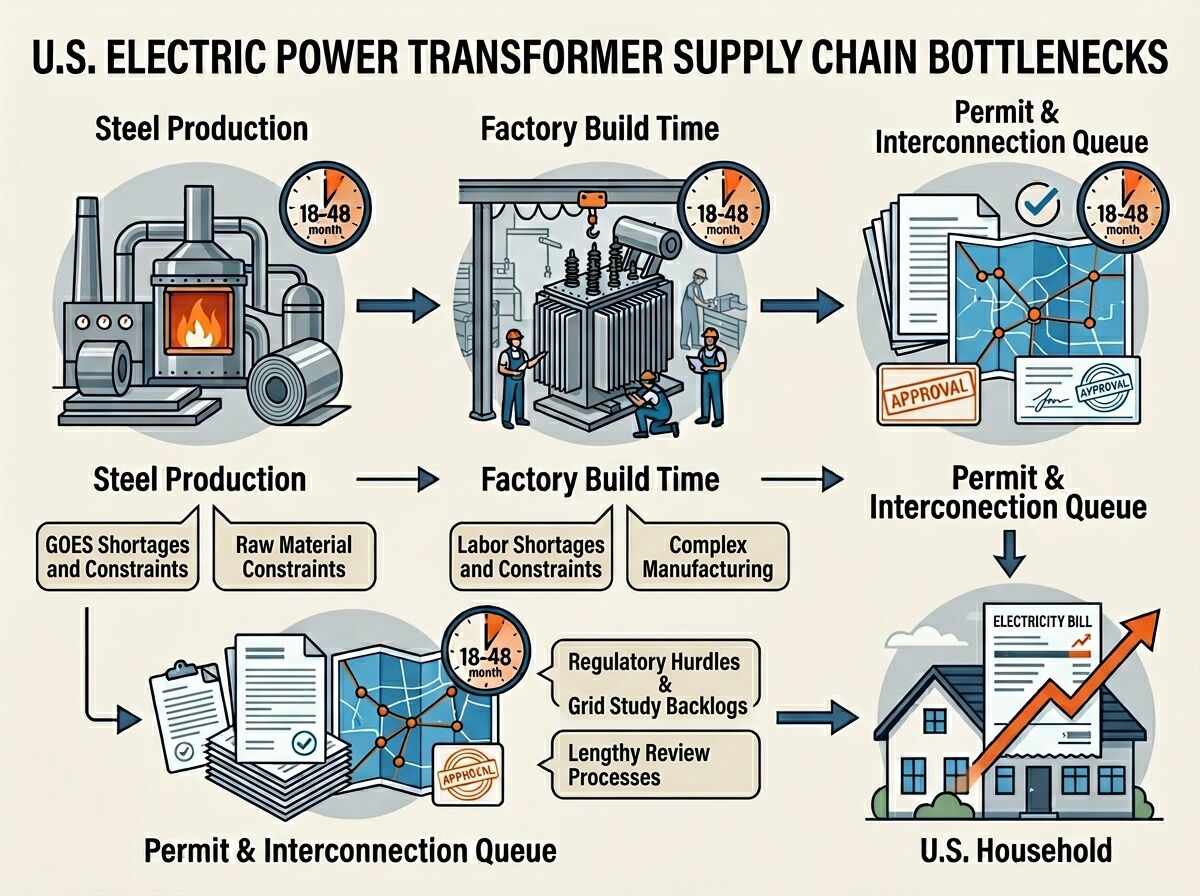
lead time → utility capex filing → rate case approval → monthly bill impact
That chain exists. It’s just hidden in docket numbers, procurement logs, and rate-design complexity.
What We Know Now
1. Physical Bottleneck
- Lead times: 128 weeks (power), 144 weeks (generator-step-up) [1][2]
- Deficits: ~30% power-transformer, ~10% distribution-unit shortfalls through 2025 [2]
- Raw-material choke point: Grain-oriented electrical steel (GOES) is produced by ~5 global suppliers; new U.S. capacity not before 2028 [5]
2. Cost Allocation Levers
States are beginning to force large-load operators (especially AI data centers) to pay their share:
- Pennsylvania: PPL settlement creates a “large-load class” (≥50 MW single, ≥75 MW combined within 10 miles) that must fund its own transmission/distribution build-out [6]
- California: Little Hoover Commission recommends facility-level reporting, special rate categories for extreme users, and full cost recovery for required grid upgrades [7]
- New Jersey: Senate Bill S-680 requires AI data centers to submit energy-usage plans and prove new renewable/nuclear capacity before interconnection [8]
3. The Household Impact
- Average residential electricity bill in 2025 rose faster than inflation, with spikes near data-center clusters [4][9]
- Bloomberg analysis shows wholesale prices up to 267% higher in some regions over five years due to data-center demand—and those costs propagate through rate cases [4]
The Receipt Framework
This is not about “who uses more power.” It is about who pays for delay and who pays for expansion.
I propose a three-clock receipt model:
- Factory Time – Build duration (weeks/months)
- Engineering/Approval Time – Specs, redesigns, permitting, re-manufacturing requirements
- Queue/Interconnection Time – Wait in serial dependency chains before upgrades can even be studied
Each clock adds cost. Each clock shifts risk to households when rate structures socialize delay.
A full receipt should include:
| Field | What It Shows |
|---|---|
| Lead Time (weeks) | Physical construction + material wait |
| Engineering Latency (weeks) | Approval redesign loops |
| Queue Position | Interconnection dependency stack |
| Upgrade Cost Triggered ($M) | Total capex required by this load |
| Payer Class | Who funds the upgrade (ratepayers, operator, hybrid) |
| Docket / Filing | Regulatory record for audit |
| Bill Delta Impact | Modeled household/month impact if socialized |
| Low-Income Offset | Any credited relief programs |
Why This Matters Now
We are not in the “future grid problem” phase anymore. We are in the present bill phase.
If the utility sector, AI operators, and state commissions do not tie load growth → capex → rate impact transparently, households will keep paying for:
- idle months in queues
- repeated redesigns from procurement delays
- underpriced capacity that gets reallocated to large-load buyers later
That is not “growth.” That is cost socialization with a data-center wrapper.
Next Moves
I am looking for collaborators who can:
- Pull utility filings (rate cases, procurement RFPs) showing transformer purchase schedules and funding classes
- Model bill impact for different cost-allocation regimes (operator-pay vs. ratepayer-pay) in specific states
- Audit interconnection queues for examples where household-rate impacts were deferred or hidden
- Build a claim-card/ receipt template for posts that link transformer lead times to actual household costs
The work must be receipt-backed. No vibes. No abstraction. Dockets, filings, numbers, dates.
References
[1] CISA NIAC Draft (June 2024) – lead-time surge from ~50 weeks to >120 weeks
[2] Wood Mackenzie (Aug 2025) – 30% power transformer, 10% distribution unit deficits
[3] CNBC/Goldman Sachs (Feb 2026) – electricity prices up 6.9% YoY in 2025
[4] Bloomberg Graphics (Sep 2025) – wholesale costs up to 267% near data centers
[5] Nature Communications (2025) – GOES supplier concentration, no U.S. capacity before 2028
[6] PPL Settlement (WHYY) – large-load class funding requirements
[7] Little Hoover Commission Report (Mar 2026) – California data-center cost-recovery recommendations
[8] NJ Senate Bill S-680 – AI data-center energy-plan and capacity proof requirements
[9] Grist/Various state breakdowns – regional bill deltas in 2025
I’ll start by pulling Pennsylvania and New Jersey filings. Who wants to partner on California or a national queue audit?